 Open Data Science Europe Metadata Catalog
Land use
Type of resources
Available actions
Topics
Keywords
Contact for the resource
Provided by
Years
Formats
Representation types
Update frequencies
status
Service types
Scale
Resolution
-

Base epoch 2015 from the Collection 3 of annual, global 100m land cover maps. Other available (consolidated) epochs: 2016 2017 2018 2019 Produced by the global component of the Copernicus Land Service, derived from PROBA-V satellite observations and ancillary datasets. The maps include: - a main discrete classification with 23 classes aligned with UN-FAO's Land Cover Classification System, - a set of versatile cover fractions: percentage (%) of ground cover for the 10 main classes - - a forest type layer quality layers on input data density Online map viewer: https://lcviewer.vito.be
-

This service visualizes land system archetypes data. Land use is a key driver of global environmental change. Unless major shifts in consumptive behaviours occur, land-based production will have to increase drastically to meet future demands for food and other commodities. To better understand the drivers and impacts of agricultural intensification, identifying global, archetypical patterns of land systems is needed. However, current approaches focus on broad-scale representations of dominant land cover with limited consideration of land-use intensity. In this study, we derived a new global representation of land systems based on more than 30 high-resolution datasets on land-use intensity, environmental conditions and socioeconomic indicators. Using a self-organizing map algorithm, we identified and mapped twelve archetypes of land systems for the year 2005. Our analysis reveals unexpected similarities in land systems across the globe but the diverse pattern at sub-national scales implies that there are no one-size-fits-all solutions to sustainable land management. Our results help to identify generic patterns of land pressures and environmental threats and provide means to target regionalized strategies to cope with the challenges of global change. Mapping global archetypes of land systems represents a first step towards better understanding the driving forces and environmental and social outcomes of land system dynamics.
-

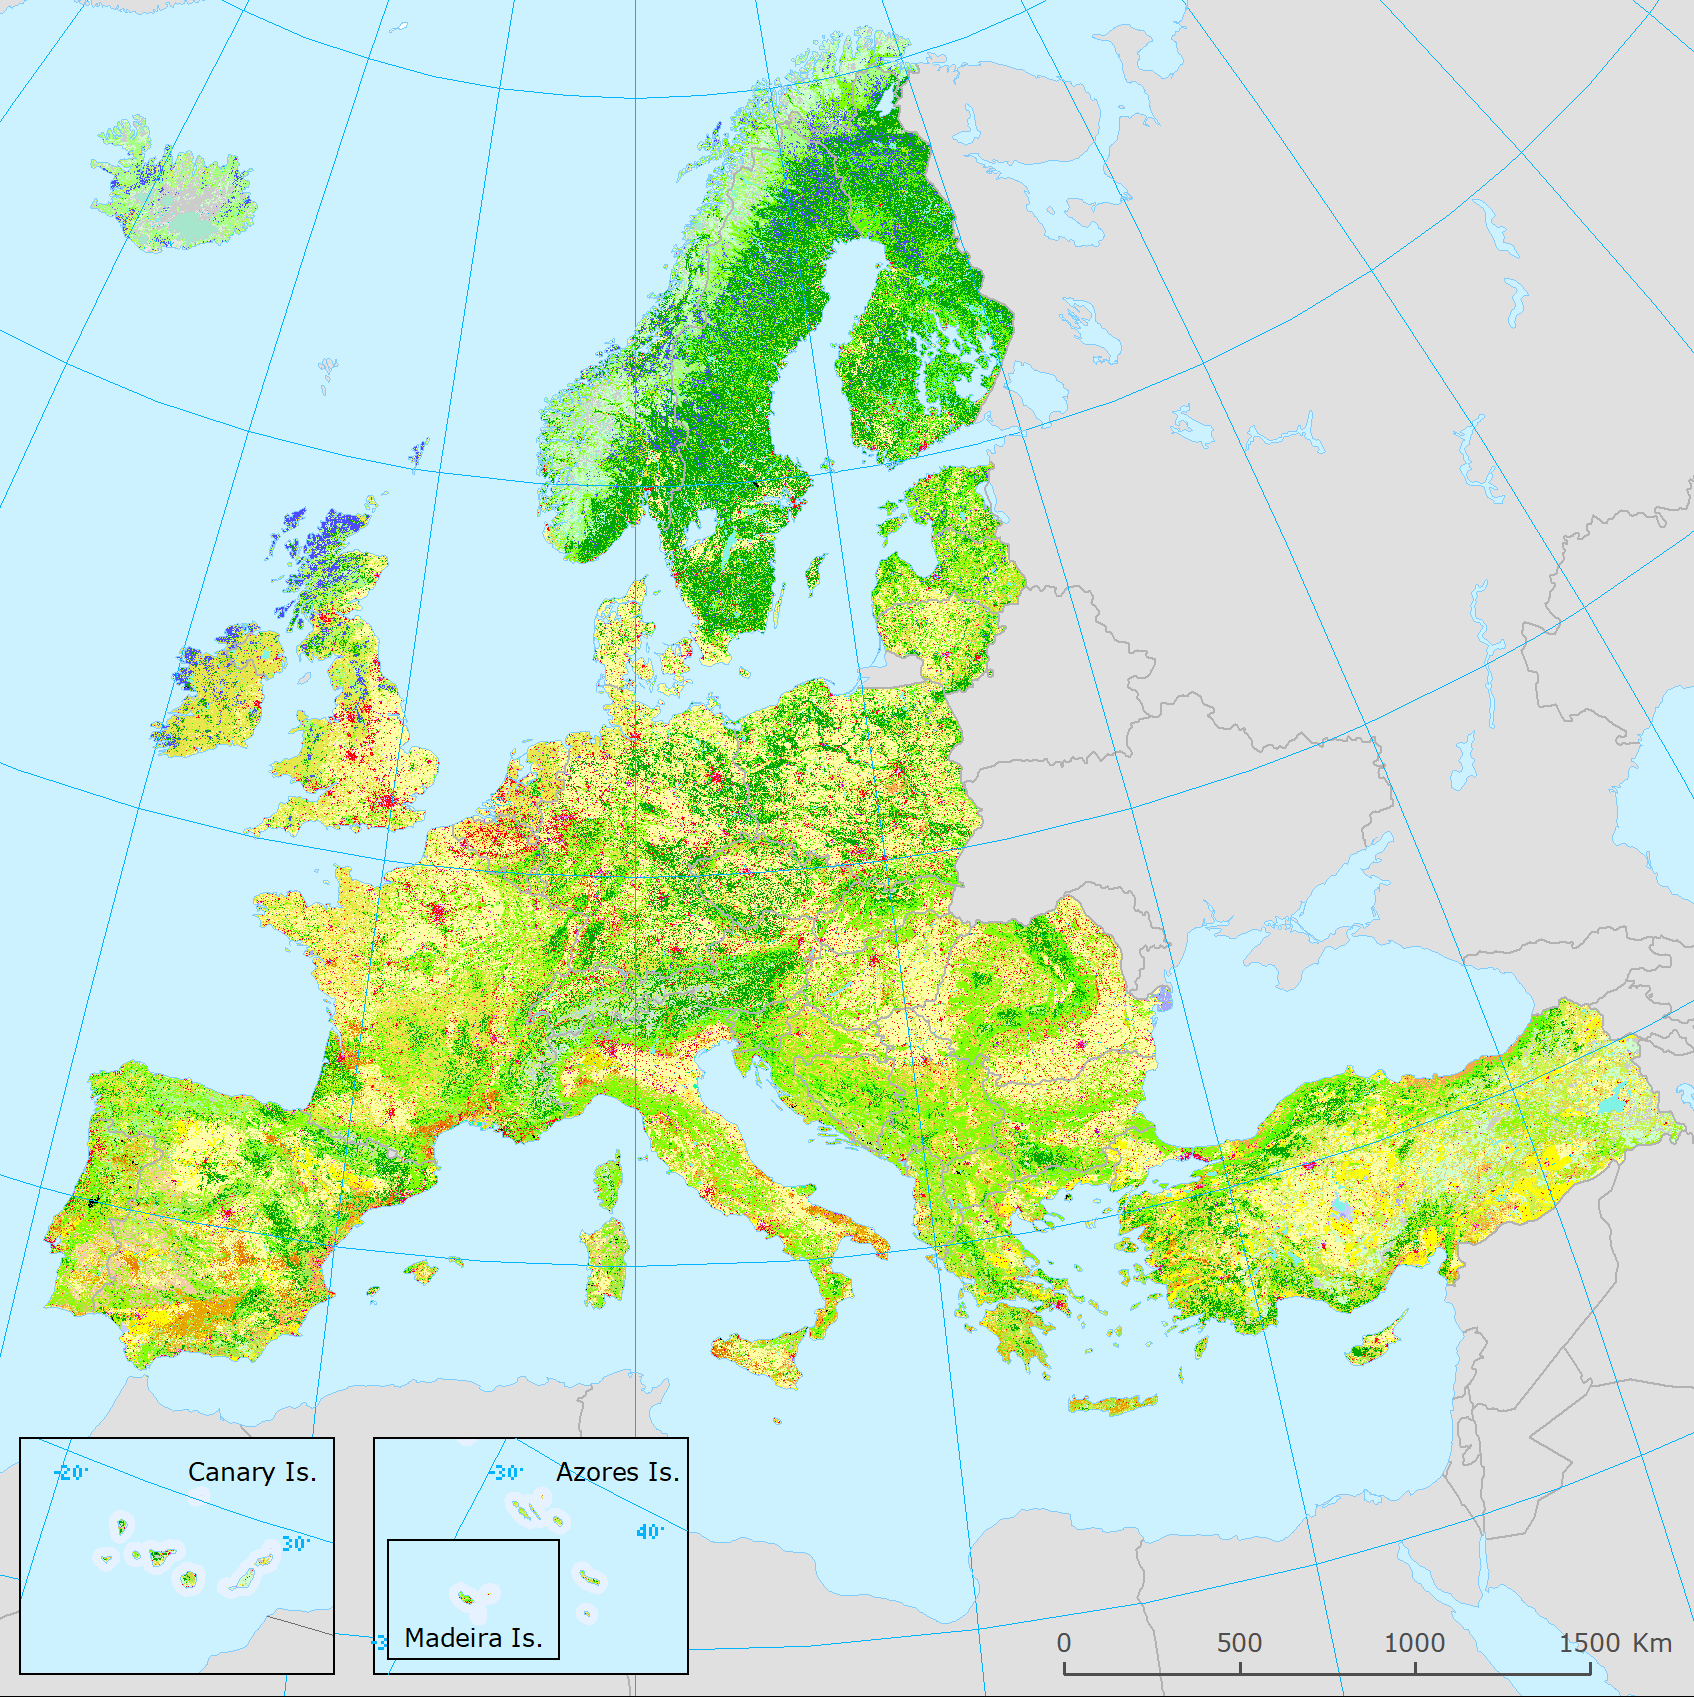
The Land Cover Map of Europe 2017 is a product resulting from the Phase 2 of the S2GLC project. The final map has been produced on the CREODIAS platform with algorithms and software developed by CBK PAN. Classification of over 15 000 Sentinel-2 images required high level of automation that was assured by the developed software. The legend of the resulting Land Cover Map of Europe 2017 consists of 13 land cover classes. The pixel size of the map equals 10 m, which corresponds to the highest spatial resolution of Sentinel-2 imagery. Its overall accuracy was estimated to be at the level of 86% using approximately 52 000 validation samples distributed across Europe. Related publication: https://doi.org/10.3390/rs12213523
-
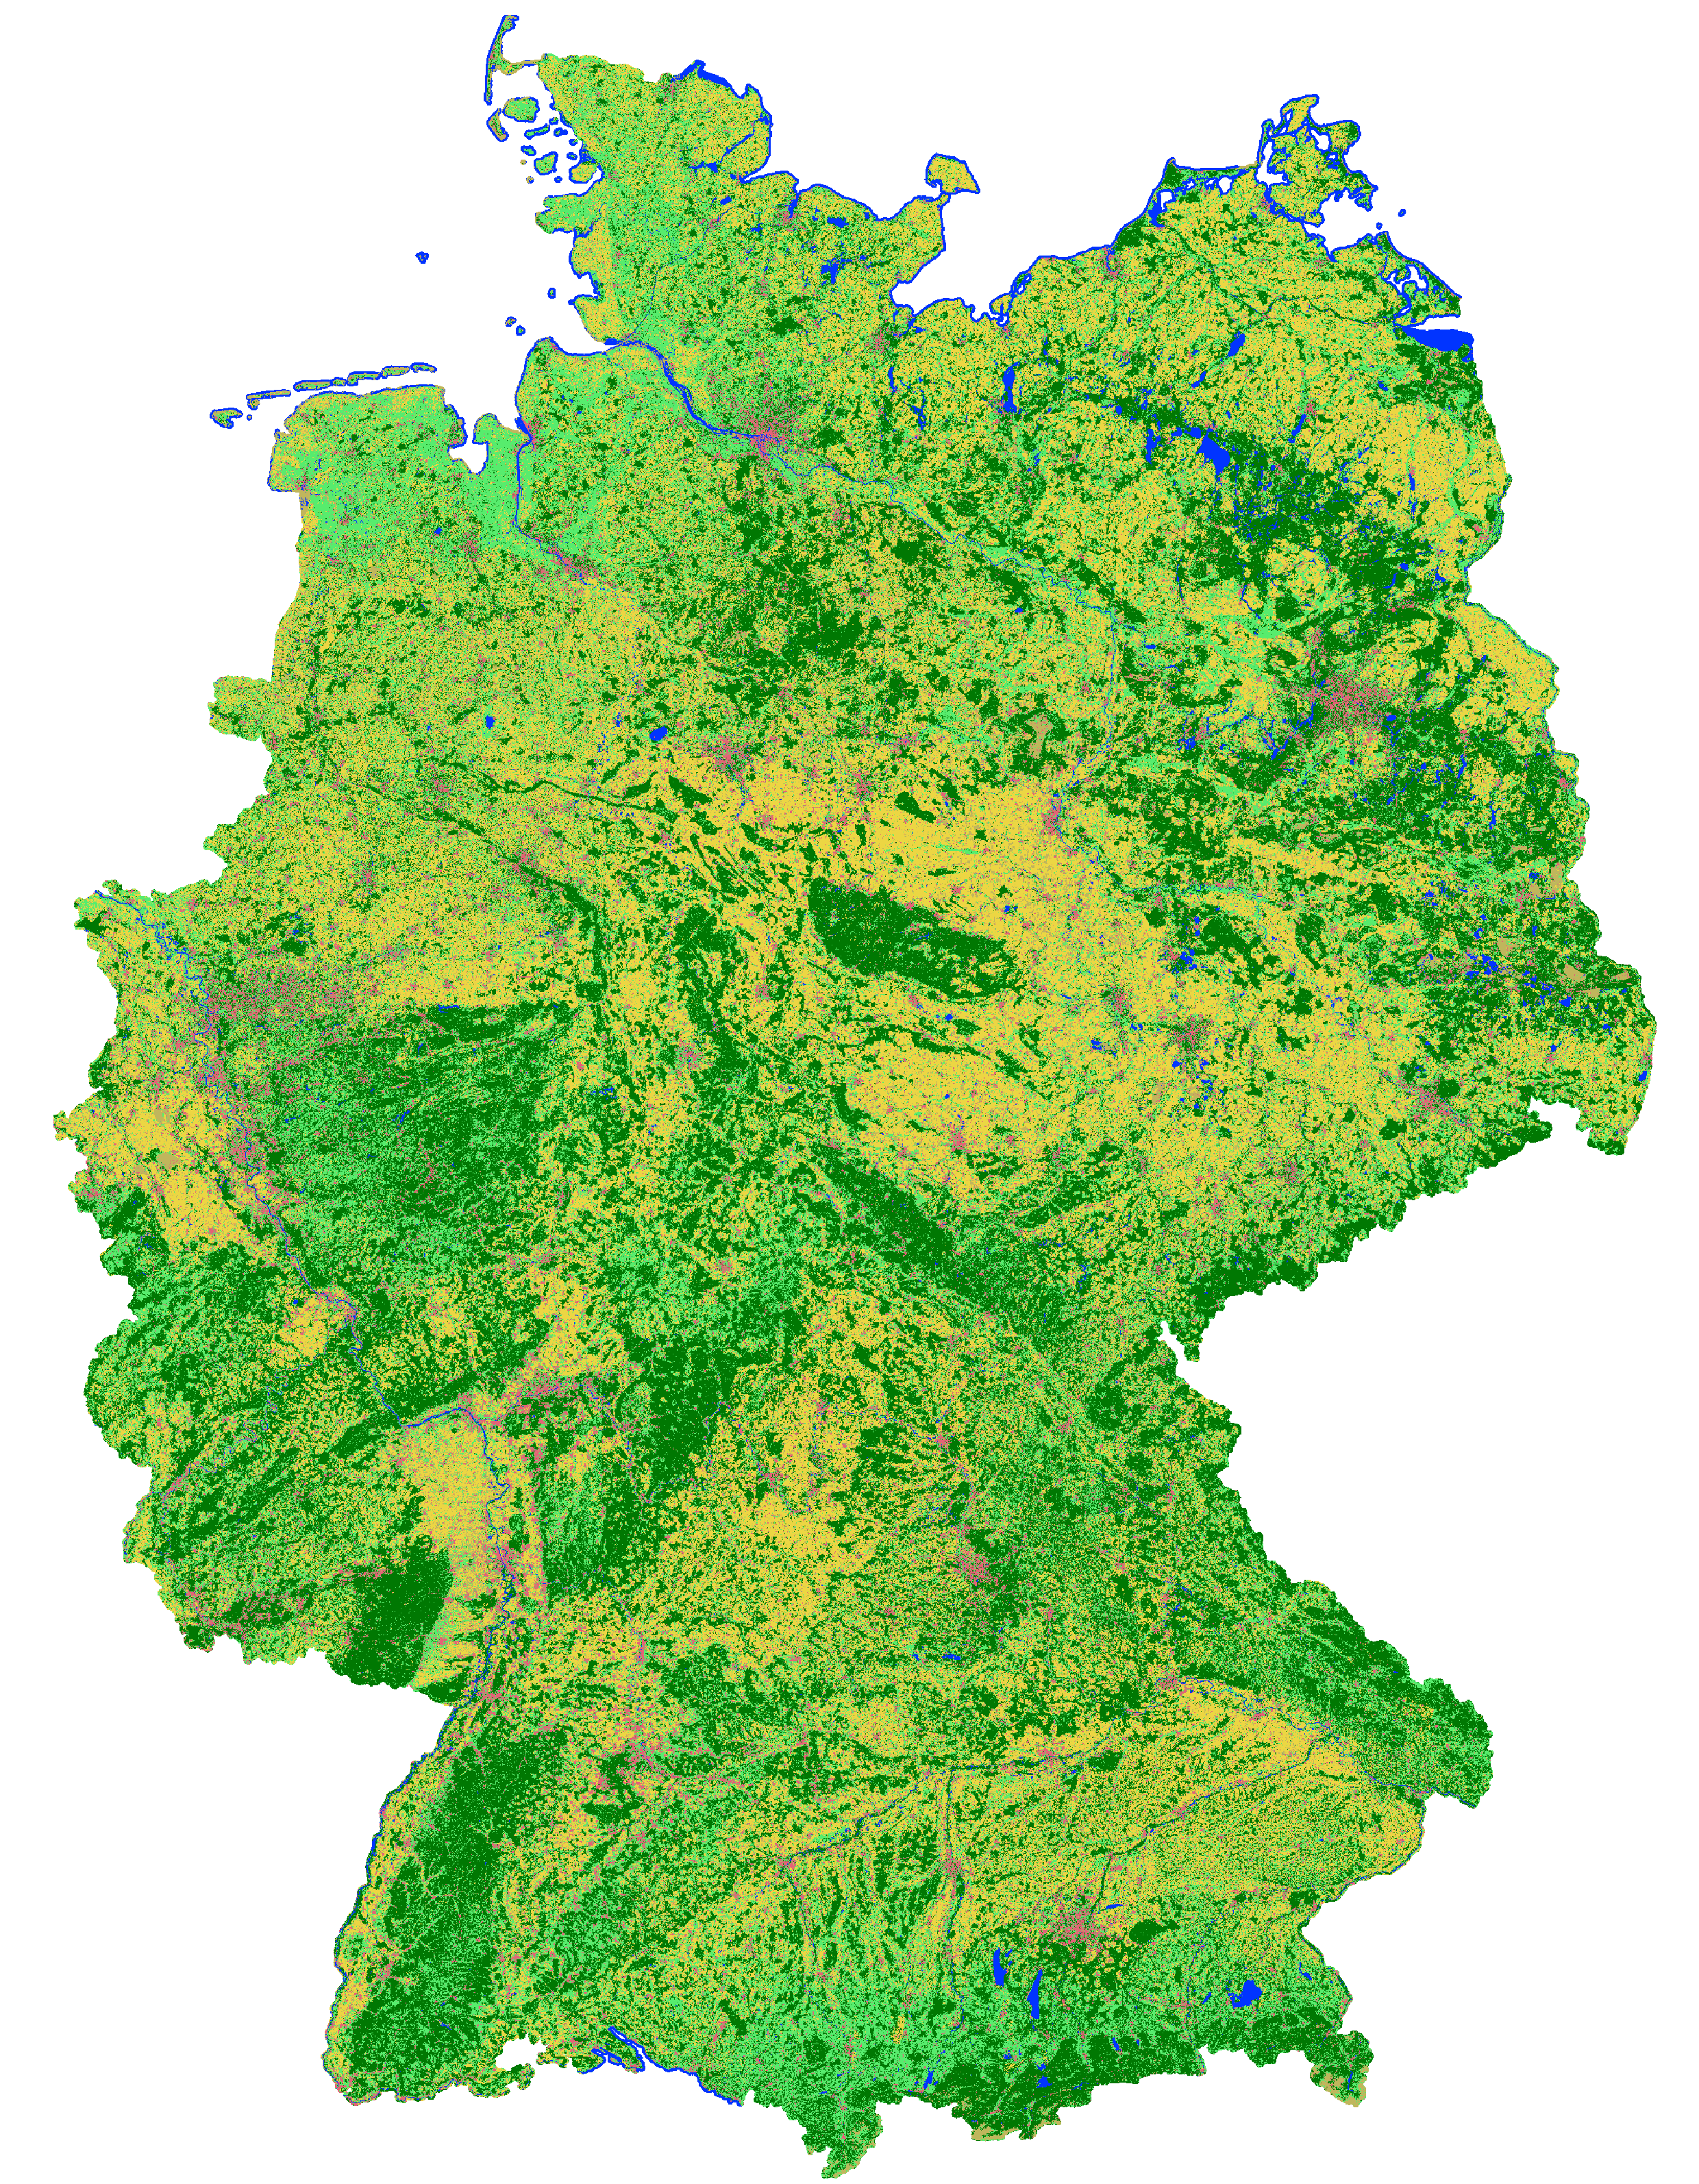
This landcover map was produced as an intermediate result in the course of the project incora (Inwertsetzung von Copernicus-Daten für die Raumbeobachtung, mFUND Förderkennzeichen: 19F2079C) in cooperation with ILS (Institut für Landes- und Stadtentwicklungsforschung gGmbH) and BBSR (Bundesinstitut für Bau-, Stadt- und Raumforschung) funded by BMVI (Federal Ministry of Transport and Digital Infrastructure). The goal of incora is an analysis of settlement and infrastructure dynamics in Germany based on Copernicus Sentinel data. This classification is based on a time-series of monthly averaged, atmospherically corrected Sentinel-2 tiles (MAJA L3A-WASP: https://geoservice.dlr.de/web/maps/sentinel2:l3a:wasp; DLR (2019): Sentinel-2 MSI - Level 2A (MAJA-Tiles)- Germany). It consists of the following landcover classes: 10: forest 20: low vegetation 30: water 40: built-up 50: bare soil 60: agriculture Potential training and validation areas were automatically extracted using spectral indices and their temporal variability from the Sentinel-2 data itself as well as the following auxiliary datasets: - OpenStreetMap (Map data copyrighted OpenStreetMap contributors and available from htttps://www.openstreetmap.org) - Copernicus HRL Imperviousness Status Map 2018 (© European Union, Copernicus Land Monitoring Service 2018, European Environment Agency (EEA)) - S2GLC Land Cover Map of Europe 2017 (Malinowski et al. 2020: Automated Production of Land Cover/Use Map of Europe Based on Sentinel-2 Imagery. Remote Sens. 2020, 12(21), 3523; https://doi.org/10.3390/rs12213523) - Germany NUTS administrative areas 1:250000 (© GeoBasis-DE / BKG 2020 / dl-de/by-2-0 / https://gdz.bkg.bund.de/index.php/default/nuts-gebiete-1-250-000-stand-31-12-nuts250-31-12.html) - Contains modified Copernicus Sentinel data (2016), processed by mundialis Processing was performed for blocks of federal states and individual maps were mosaicked afterwards. For each class 100,000 pixels from the potential training areas were extracted as training data. An exemplary validation of the classification results was perfomed for the federal state of North Rhine-Westphalia as its open data policy allows for direct access to official data to be used as reference. Rules to convert relevant ATKIS Basis-DLM object classes to the incora nomenclature were defined. Subsequently, 5.000 reference points were randomly sampled and their classification in each case visually examined and, if necessary, revised to obtain a robust reference data set. The comparison of this reference data set with the incora classification yielded the following results: overall accurary: 88.4% class: user's accuracy / producer's accurary (number of reference points n) forest: 96.7% / 94.3% (1410) low vegetation: 70.6% / 84.0% (844) water: 98.5% / 94.2% (69) built-up: 98.2% / 89.8% (983) bare soil: 19.7% / 58.5% (41) agriculture: 91.7% / 85.3% (1653) Incora report with details on methods and results: pending
-
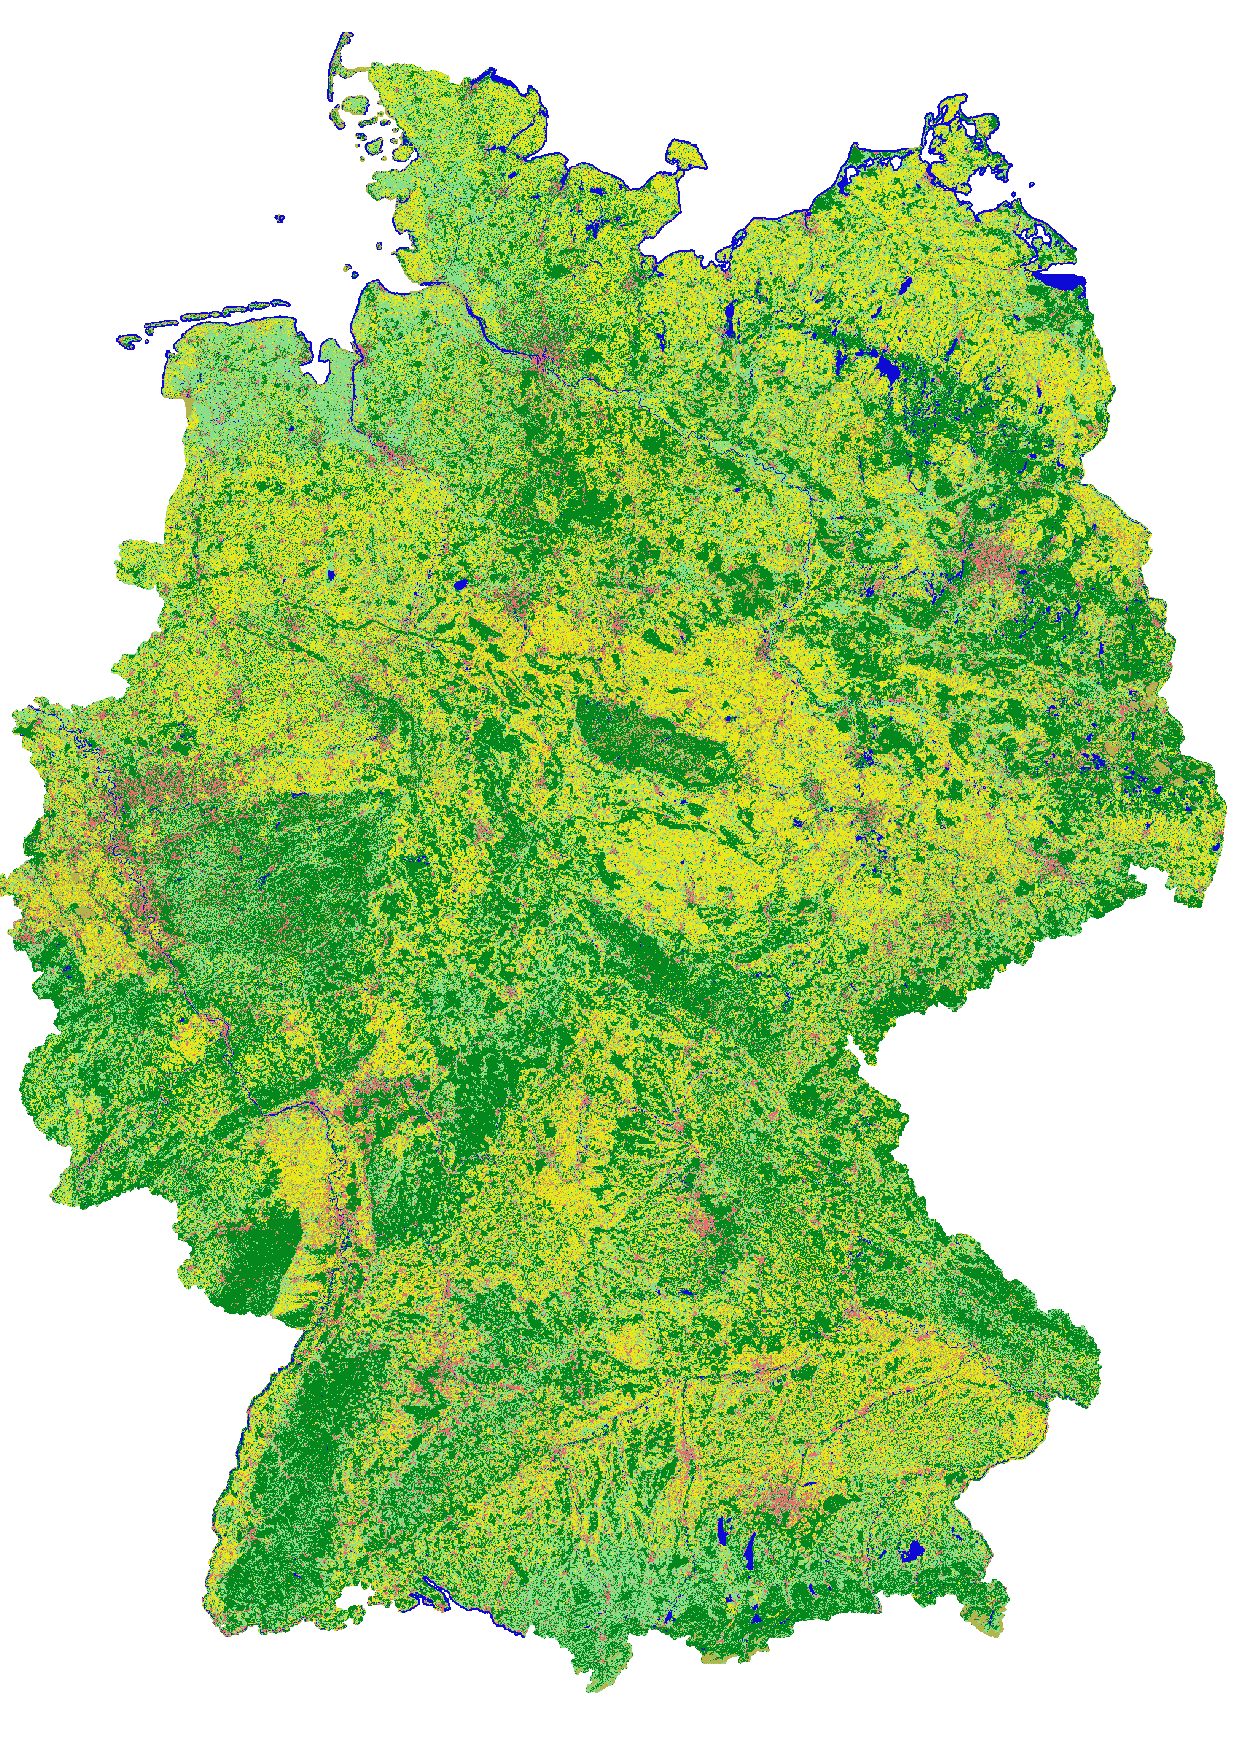
This landcover map was produced with a classification method developed in the project incora (Inwertsetzung von Copernicus-Daten für die Raumbeobachtung, mFUND Förderkennzeichen: 19F2079C) in cooperation with ILS (Institut für Landes- und Stadtentwicklungsforschung gGmbH) and BBSR (Bundesinstitut für Bau-, Stadt- und Raumforschung) funded by BMVI (Federal Ministry of Transport and Digital Infrastructure). The goal of incora is an analysis of settlement and infrastructure dynamics in Germany based on Copernicus Sentinel data. Even though the project is concluded, the annual land cover classification product is continuously generated. This classification is based on a time-series of monthly averaged, atmospherically corrected Sentinel-2 tiles (MAJA L3A-WASP: https://geoservice.dlr.de/web/maps/sentinel2:l3a:wasp; DLR (2019): Sentinel-2 MSI - Level 2A (MAJA-Tiles)- Germany). It consists of the following landcover classes: 10: forest 20: low vegetation 30: water 40: built-up 50: bare soil 60: agriculture Potential training and validation areas were automatically extracted using spectral indices and their temporal variability from the Sentinel-2 data itself as well as the following auxiliary datasets: - OpenStreetMap (Map data copyrighted OpenStreetMap contributors and available from htttps://www.openstreetmap.org) - Copernicus HRL Imperviousness Status Map 2018 (© European Union, Copernicus Land Monitoring Service 2018, European Environment Agency (EEA)) - S2GLC Land Cover Map of Europe 2017 (Malinowski et al. 2020: Automated Production of Land Cover/Use Map of Europe Based on Sentinel-2 Imagery. Remote Sens. 2020, 12(21), 3523; https://doi.org/10.3390/rs12213523) - Germany NUTS administrative areas 1:250000 (© GeoBasis-DE / BKG 2020 / dl-de/by-2-0 / https://gdz.bkg.bund.de/index.php/default/nuts-gebiete-1-250-000-stand-31-12-nuts250-31-12.html) - Contains modified Copernicus Sentinel data (2020), processed by mundialis Processing was performed for blocks of federal states and individual maps were mosaicked afterwards. For each class 100,000 pixels from the potential training areas were extracted as training data. An exemplary validation of the classification results was perfomed for the federal state of North Rhine-Westphalia as its open data policy allows for direct access to official data to be used as reference. Rules to convert relevant ATKIS Basis-DLM object classes to the incora nomenclature were defined. Subsequently, 5.000 reference points were randomly sampled and their classification in each case visually examined and, if necessary, revised to obtain a robust reference data set. The comparison of this reference data set with the incora classification yielded the following results: overall accuracy: 83.5% class: user's accuracy / producer's accuracy (number of reference points n) forest: 90.6% / 91.9% (1410) low vegetation: 69.2% / 82.8% (844) water: 97.0% / 94.2% (69) built-up: 96.5% / 97.4% (983) bare soil: 8.5% / 68.3% (41) agriculture: 96.6% / 68.4% (1653) Compared to the previous years, the overall accuracy and accuracies of some classes is reduced. 2021 was a rather cloudy year in Germany, which means that the detection of agricultural areas is hampered as it is based on the variance of the NDVI throughout the year. With fewer cloud-free images available, the NDVI variance is not fully covered and as no adaptations have been applied to the algorithm, agricultural fields may get classified as low vegetation or bare soil more often. Another reason for lower classification accuracy is the significant damage that occured to forest areas due to storm and bark beetle. The validation dataset was generated based on aerial imagery from the years 2018/2019 which and is slowly becoming obsolete. An up-to-date validation dataset will be applied. Incora report with details on methods and results: pending
-

This landcover map was produced as an intermediate result in the course of the project incora (Inwertsetzung von Copernicus-Daten für die Raumbeobachtung, mFUND Förderkennzeichen: 19F2079C) in cooperation with ILS (Institut für Landes- und Stadtentwicklungsforschung gGmbH) and BBSR (Bundesinstitut für Bau-, Stadt- und Raumforschung) funded by BMVI (Federal Ministry of Transport and Digital Infrastructure). The goal of incora is an analysis of settlement and infrastructure dynamics in Germany based on Copernicus Sentinel data. This classification is based on a time-series of monthly averaged, atmospherically corrected Sentinel-2 tiles (MAJA L3A-WASP: https://geoservice.dlr.de/web/maps/sentinel2:l3a:wasp; DLR (2019): Sentinel-2 MSI - Level 2A (MAJA-Tiles)- Germany). It consists of the following landcover classes: 10: forest 20: low vegetation 30: water 40: built-up 50: bare soil 60: agriculture Potential training and validation areas were automatically extracted using spectral indices and their temporal variability from the Sentinel-2 data itself as well as the following auxiliary datasets: - OpenStreetMap (Map data copyrighted OpenStreetMap contributors and available from htttps://www.openstreetmap.org) - Copernicus HRL Imperviousness Status Map 2018 (© European Union, Copernicus Land Monitoring Service 2018, European Environment Agency (EEA)) - S2GLC Land Cover Map of Europe 2017 (Malinowski et al. 2020: Automated Production of Land Cover/Use Map of Europe Based on Sentinel-2 Imagery. Remote Sens. 2020, 12(21), 3523; https://doi.org/10.3390/rs12213523) - Germany NUTS administrative areas 1:250000 (© GeoBasis-DE / BKG 2020 / dl-de/by-2-0 / https://gdz.bkg.bund.de/index.php/default/nuts-gebiete-1-250-000-stand-31-12-nuts250-31-12.html) - Contains modified Copernicus Sentinel data (2019), processed by mundialis Processing was performed for blocks of federal states and individual maps were mosaicked afterwards. For each class 100,000 pixels from the potential training areas were extracted as training data. An exemplary validation of the classification results was perfomed for the federal state of North Rhine-Westphalia as its open data policy allows for direct access to official data to be used as reference. Rules to convert relevant ATKIS Basis-DLM object classes to the incora nomenclature were defined. Subsequently, 5.000 reference points were randomly sampled and their classification in each case visually examined and, if necessary, revised to obtain a robust reference data set. The comparison of this reference data set with the incora classification yielded the following results: overall accurary: 91.9% class: user's accuracy / producer's accurary (number of reference points n) forest: 98.1% / 95.9% (1410) low vegetation: 76.4% / 91.5% (844) water: 98.4% / 92.8% (69) built-up: 99.2% / 97.4% (983) bare soil: 35.1% / 95.1% (41) agriculture: 95.9% / 85.3% (1653) Incora report with details on methods and results: pending
-

This landcover map was produced with a classification method developed in the project incora (Inwertsetzung von Copernicus-Daten für die Raumbeobachtung, mFUND Förderkennzeichen: 19F2079C) in cooperation with ILS (Institut für Landes- und Stadtentwicklungsforschung gGmbH) and BBSR (Bundesinstitut für Bau-, Stadt- und Raumforschung) funded by BMVI (Federal Ministry of Transport and Digital Infrastructure). The goal of incora is an analysis of settlement and infrastructure dynamics in Germany based on Copernicus Sentinel data. This classification is based on a time-series of monthly averaged, atmospherically corrected Sentinel-2 tiles (MAJA L3A-WASP: https://geoservice.dlr.de/web/maps/sentinel2:l3a:wasp; DLR (2019): Sentinel-2 MSI - Level 2A (MAJA-Tiles)- Germany). It consists of the following landcover classes: 10: forest 20: low vegetation 30: water 40: built-up 50: bare soil 60: agriculture Potential training and validation areas were automatically extracted using spectral indices and their temporal variability from the Sentinel-2 data itself as well as the following auxiliary datasets: - OpenStreetMap (Map data copyrighted OpenStreetMap contributors and available from htttps://www.openstreetmap.org) - Copernicus HRL Imperviousness Status Map 2018 (© European Union, Copernicus Land Monitoring Service 2018, European Environment Agency (EEA)) - S2GLC Land Cover Map of Europe 2017 (Malinowski et al. 2020: Automated Production of Land Cover/Use Map of Europe Based on Sentinel-2 Imagery. Remote Sens. 2020, 12(21), 3523; https://doi.org/10.3390/rs12213523) - Germany NUTS administrative areas 1:250000 (© GeoBasis-DE / BKG 2020 / dl-de/by-2-0 / https://gdz.bkg.bund.de/index.php/default/nuts-gebiete-1-250-000-stand-31-12-nuts250-31-12.html) - Contains modified Copernicus Sentinel data (2020), processed by mundialis Processing was performed for blocks of federal states and individual maps were mosaicked afterwards. For each class 100,000 pixels from the potential training areas were extracted as training data. An exemplary validation of the classification results was perfomed for the federal state of North Rhine-Westphalia as its open data policy allows for direct access to official data to be used as reference. Rules to convert relevant ATKIS Basis-DLM object classes to the incora nomenclature were defined. Subsequently, 5.000 reference points were randomly sampled and their classification in each case visually examined and, if necessary, revised to obtain a robust reference data set. The comparison of this reference data set with the incora classification yielded the following results: overall accurary: 88.4% class: user's accuracy / producer's accurary (number of reference points n) forest: 95.0% / 93.8% (1410) low vegetation: 73.4% / 86.5% (844) water: 98.5% / 92.8% (69) built-up: 98.9% / 95.8% (983) bare soil: 23.9% / 82.9% (41) agriculture: 94.6% / 83.2% (1653) Incora report with details on methods and results: pending
-

OpenStreetMap (OSM) is a collaborative project to create a free editable map of the world. OSM is considered a prominent example of volunteered geographic information. Data are collected using manual survey, GPS devices, aerial photography, and other free sources. This crowdsourced data are then made available under the Open Database License.
-
The present 100m raster dataset is the 2018 CLC status layer modified for the purpose of consistent statistical analysis in the land cover change accounting system at EEA. CORINE Land Cover (CLC) data are produced from 1986 for European (EEA member or cooperating) countries. Altogether five mapping inventories were implemented in this period, producing five status layers (CLC1990, CLC2000, CLC2006, CLC2012, CLC2018) and four CLC-Change (CLCC) layers for the corresponding periods (1990-2000, 2000-2006, 2006-2012, 2012-2018). Pan-European CLC and CLCC data are available as vector and raster products. Due to the technical characteristics of CLC and CLCC data, the evolution in CLC update methodology and in quality of input data, time-series statistics derived directly from historical CLC data includes several inconsistencies. In order to create a statistically solid basis for CLC-based time series analysis, a harmonization methodology was elaborated.
-
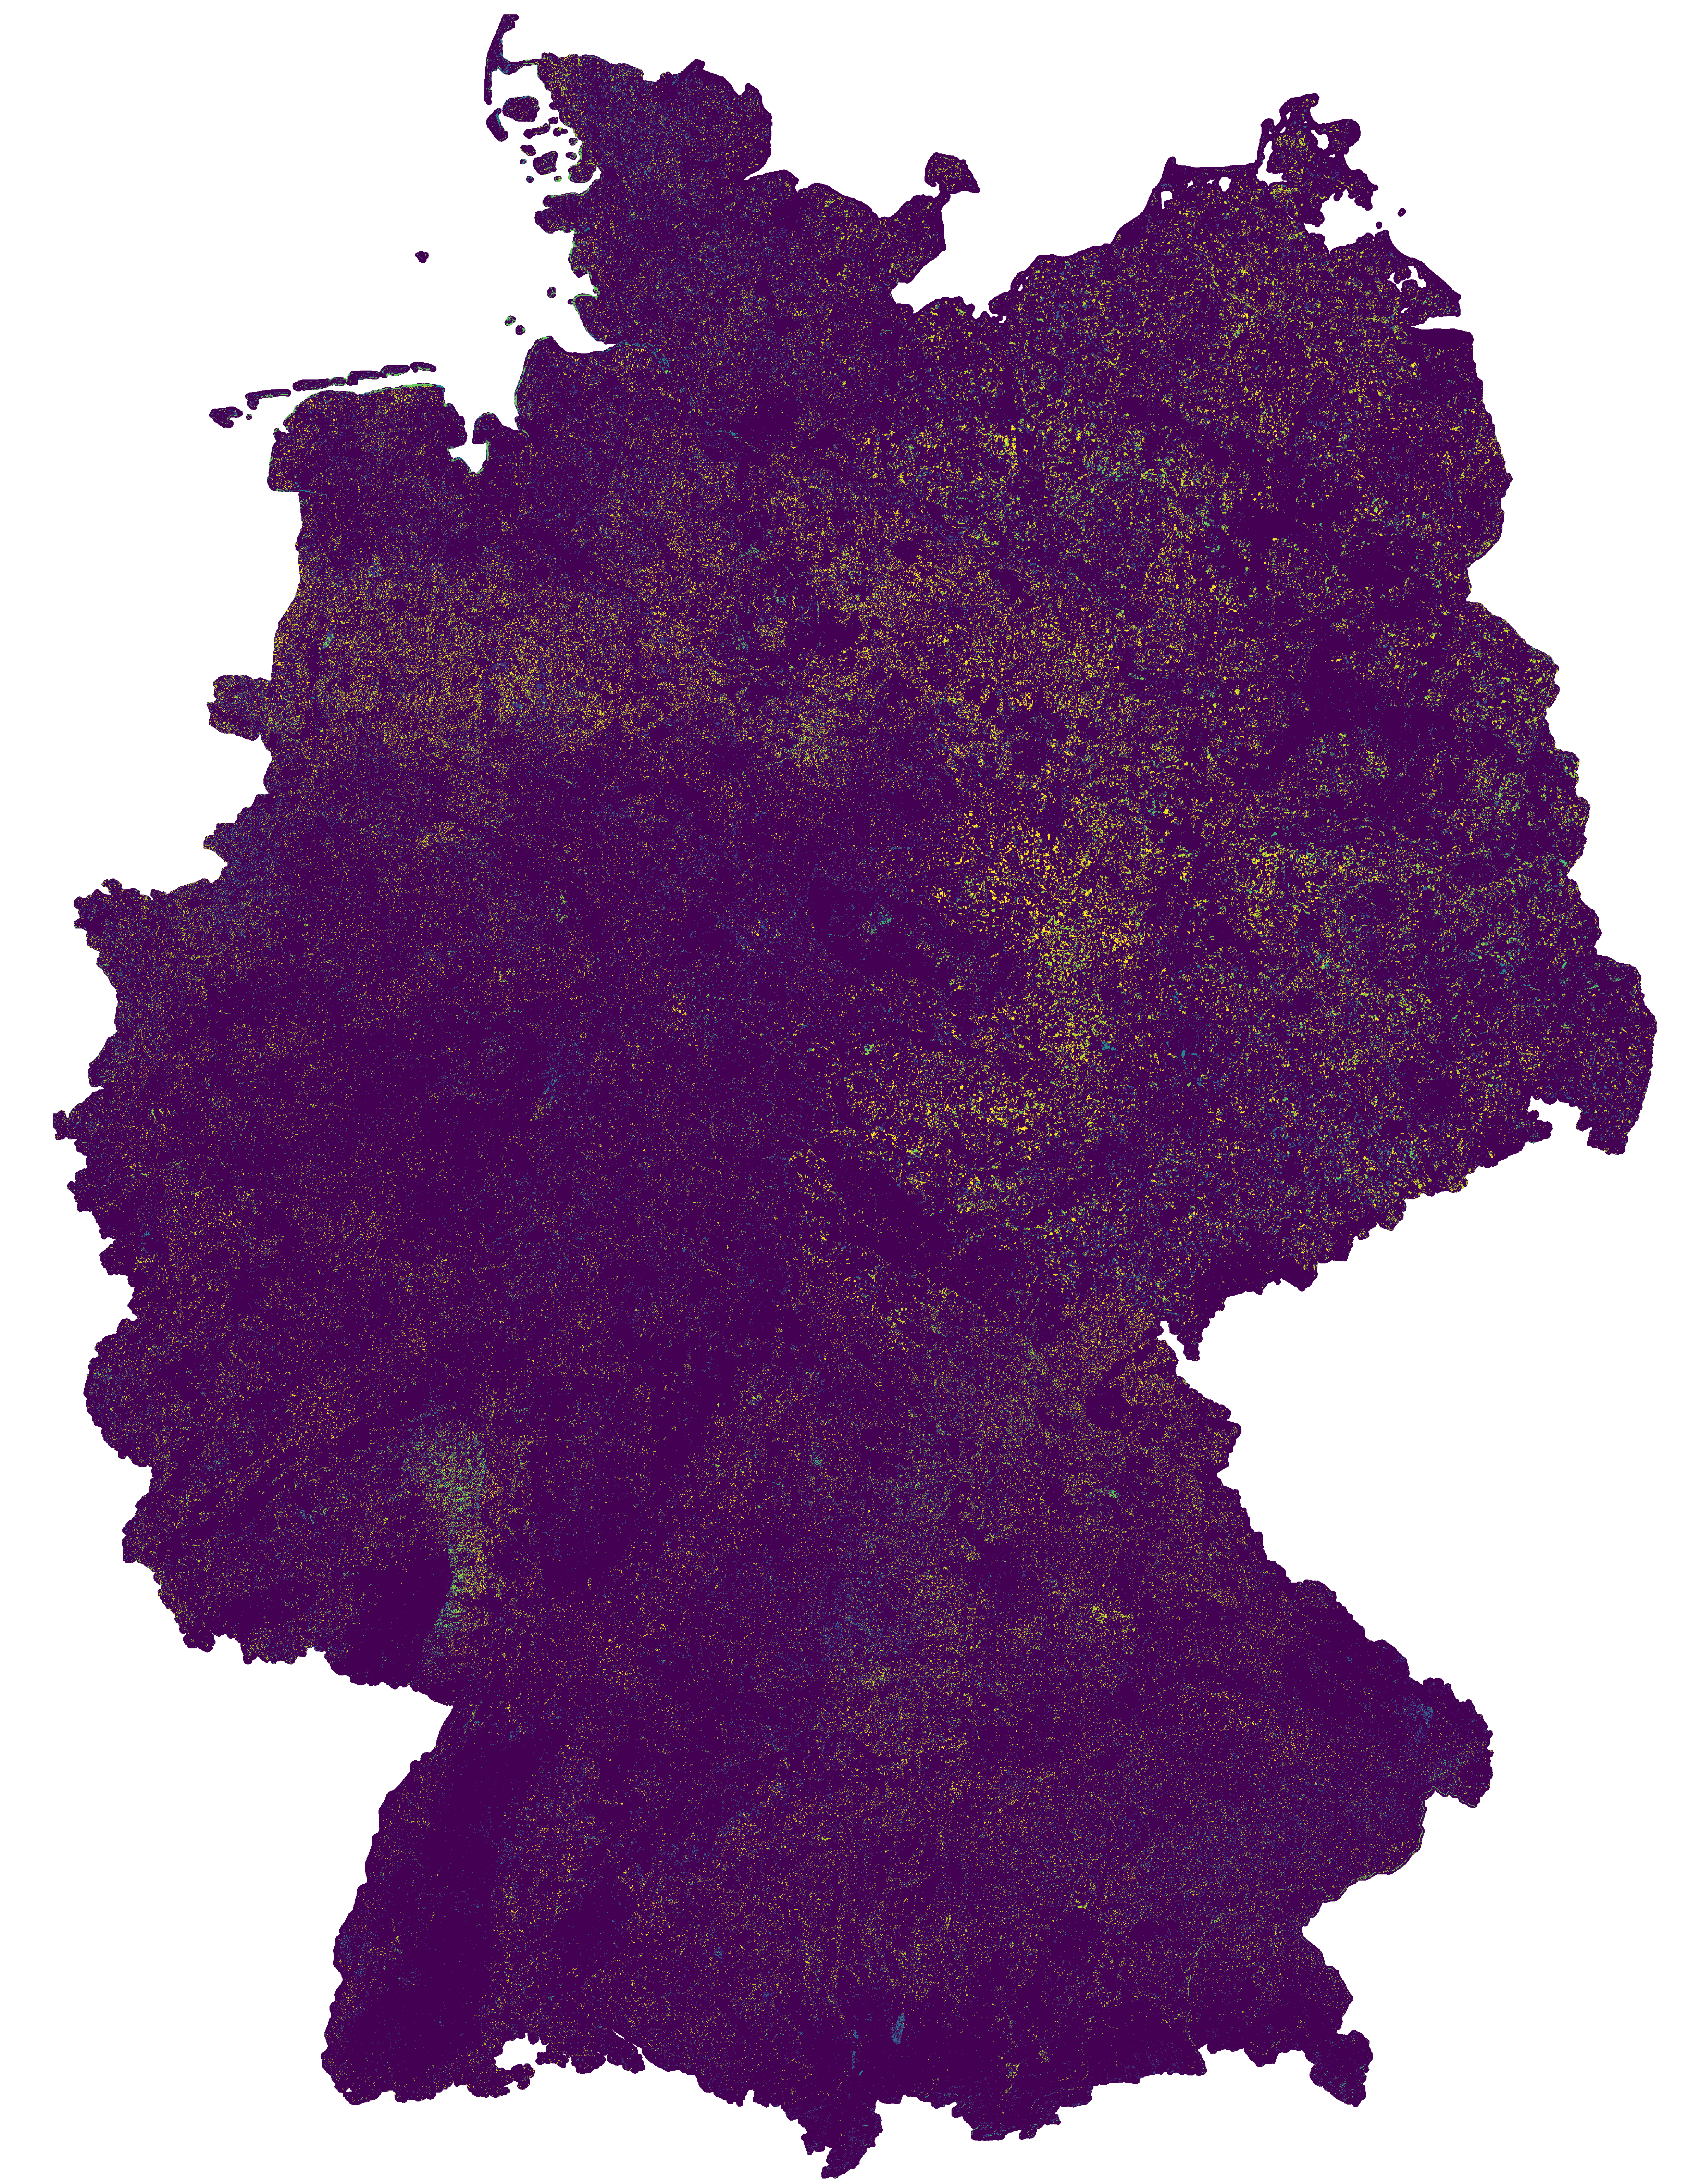
This change map was produced as an intermediate result in the course of the project incora (Inwertsetzung von Copernicus-Daten für die Raumbeobachtung, mFUND Förderkennzeichen: 19F2079C) in cooperation with ILS (Institut für Landes- und Stadtentwicklungsforschung gGmbH) and BBSR (Bundesinstitut für Bau-, Stadt- und Raumforschung) funded by BMVI (Federal Ministry of Transport and Digital Infrastructure). The goal of incora is an analysis of settlement and infrastructure dynamics in Germany based on Copernicus Sentinel data. The map indicates land cover changes between the years 2016 and 2019. It is a difference map from two classifications based on Sentinel-2 MAJA data (MAJA L3A-WASP: https://geoservice.dlr.de/web/maps/sentinel2:l3a:wasp; DLR (2019): Sentinel-2 MSI - Level 2A (MAJA-Tiles)- Germany). More information on the two basis classifications can be found here: https://data.mundialis.de/geonetwork/srv/eng/catalog.search#/metadata/db130a09-fc2e-421d-95e2-1575e7c4b45c https://data.mundialis.de/geonetwork/srv/eng/catalog.search#/metadata/36512b46-f3aa-4aa4-8281-7584ec46c813 To keep only significant changes in the change detection map, the following postprocessing steps are applied to the initial difference raster: - Modefilter (3x3) to eliminate isolated pixels and edge effects - Information gain in a 4x4 window compares class distribution within the window from the two timesteps. High values indicate that the class distribution in the window has changed, and thus a change is likely. Gain ranges from 0 to 1, all changes < 0.5 are omitted. - Change areas < 1ha are removed The resulting map has the following nomenclature: 0: No Change 1: Change from low vegetation to forest 2: Change from water to forest 3: Change from built-up to forest 4: Change from bare soil to forest 5: Change from agriculture to forest 6: Change from forest to low vegetation 7: Change from water to low vegetation 8: Change from built-up to low vegetation 9: Change from bare soil to low vegetation 10: Change from agriculture to low vegetation 11: Change from forest to water 12: Change from low vegetation to water 13: Change from built-up to water 14: Change from bare soil to water 15: Change from agriculture to water 16: Change from forest to built-up 17: Change from low vegetation to built-up 18: Change from water to built-up 19: Change from bare soil to built-up 20: Change from agriculture to built-up 21: Change from forest to bare soil 22: Change from low vegetation to bare soil 23: Change from water to bare soil 24: Change from built-up to bare soil 25: Change from agriculture to bare soil 26: Change from forest to agriculture 27: Change from low vegetation to agriculture 28: Change from water to agriculture 29: Change from built-up to agriculture 30: Change from bare soil to agriculture - Contains modified Copernicus Sentinel data (2016/2019), processed by mundialis Incora report with details on methods and results: pending